Project management
How to use Gantt charts in Gravitask
A complete guide to the Gravitask Gantt chart. We will cover what a Gantt chart is, when to use one, how to schedule tasks, link dependencies, see the critical path, mark milestones, switch density, share with stakeholders, and avoid the four most common mistakes. With screenshots from a real project plan.
A good Gantt chart turns a list of tasks into a plan. It shows you when work starts, when it finishes, what depends on what, where the project is right now, and which delays would actually move the launch date. This guide walks through the Gantt chart in Gravitask end to end, with screenshots of every feature you are likely to use in the first week. By the end you will know how to plan a project, link dependencies, identify the critical path, mark milestones, change the time density, and share the timeline with stakeholders.
TL;DR
Open any project in Gravitask, switch the view to Timeline, give each task a start and due date, then drag from one task bar to the next to link a dependency. Toggle Dependency mode to highlight the critical path. Click Milestone to add a launch date marker. Switch between Day, Week and Month density depending on the level of detail you need.
What is a Gantt chart?
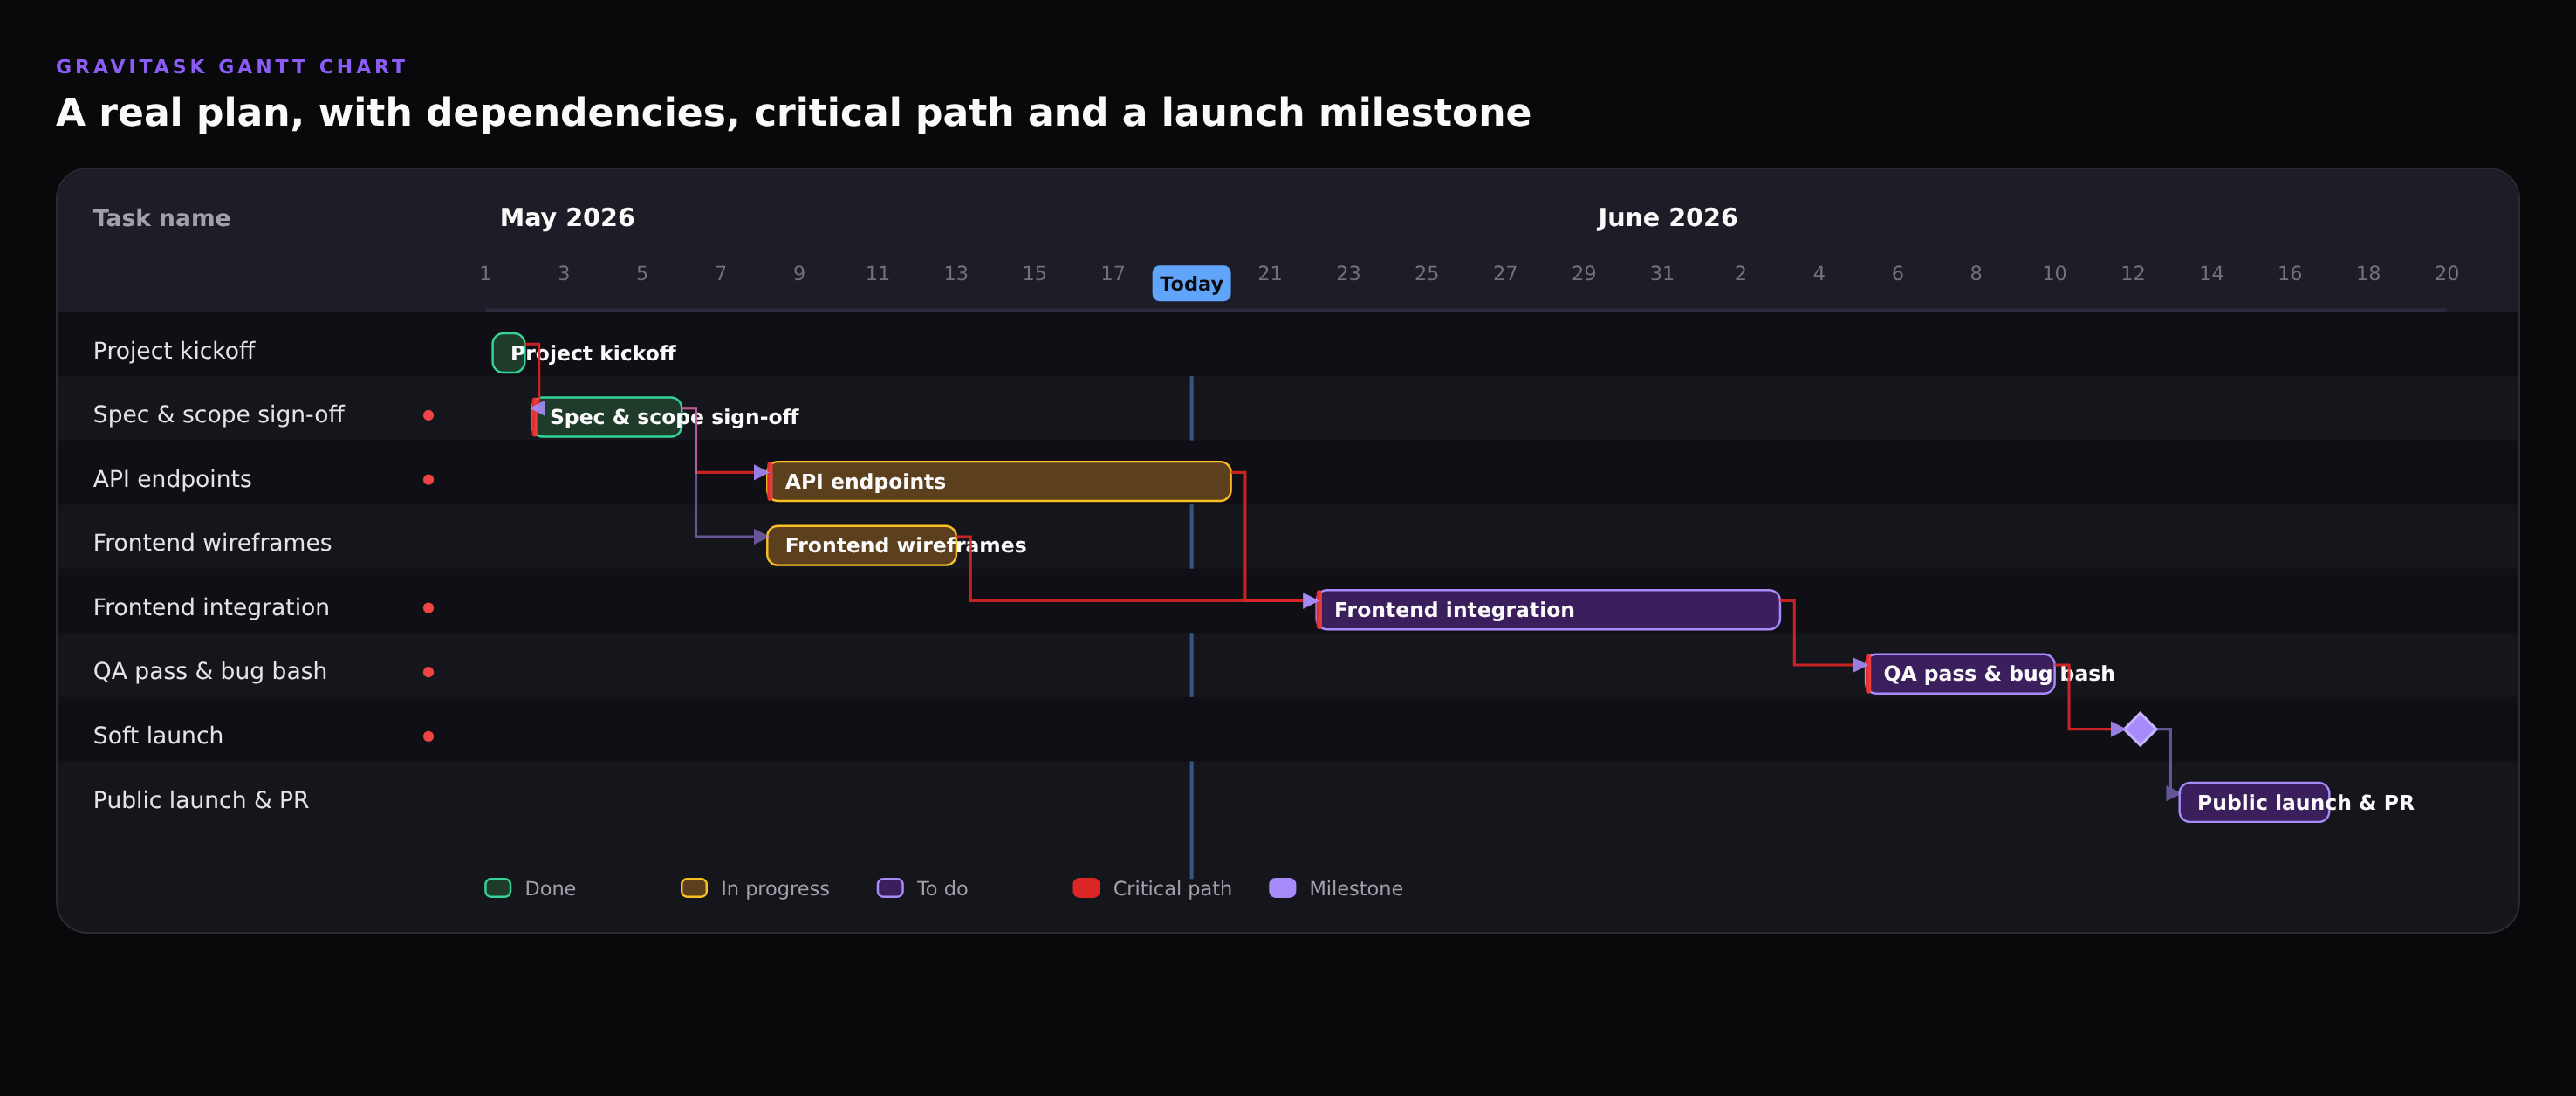
A Gantt chart is a horizontal bar chart of tasks plotted against time. Each row is one task; the position and length of the bar show when the work starts, how long it takes, and where it finishes. Arrows between bars show dependencies: which task must finish before another can start. The chart was popularised by Henry Gantt in the 1910s and has been the default planning view for project managers ever since because it answers four questions a list view cannot: what is happening when, what blocks what, what is on the critical path, and what is at risk of slipping.
A Gantt chart is most useful when at least one of the following is true: the project has a fixed deadline, multiple workstreams overlap, or some tasks cannot start until others finish. If your project is a flat backlog of independent tasks, a Kanban board is usually a better fit. If you need to communicate sequence and timing to stakeholders, a Gantt chart is the right tool.
When to use a Gantt chart (and when not to)
- Use a Gantt chart when the project has a hard launch date, when teams are handing off work between each other, when several streams need to be coordinated, when stakeholders ask "are we going to make it?", or when a slip in one place has knock-on effects elsewhere.
- Skip the Gantt chart when the work is open-ended (research, exploration, evergreen maintenance), when the team is small enough that everyone already knows what is happening, or when you would spend more time keeping the chart up to date than doing the work it represents.
Gantt chart vs Kanban board
Gantt is for time-based planning (what happens when, what depends on what). Kanban is for flow management (what is in progress right now, where the bottlenecks are). Most teams use both: Gantt for the launch plan, Kanban for the day-to-day execution. Gravitask lets you flip between Timeline, Board, List, Calendar and Dashboard views on the same project without losing data.
Step 1. Switch your project to the Timeline view
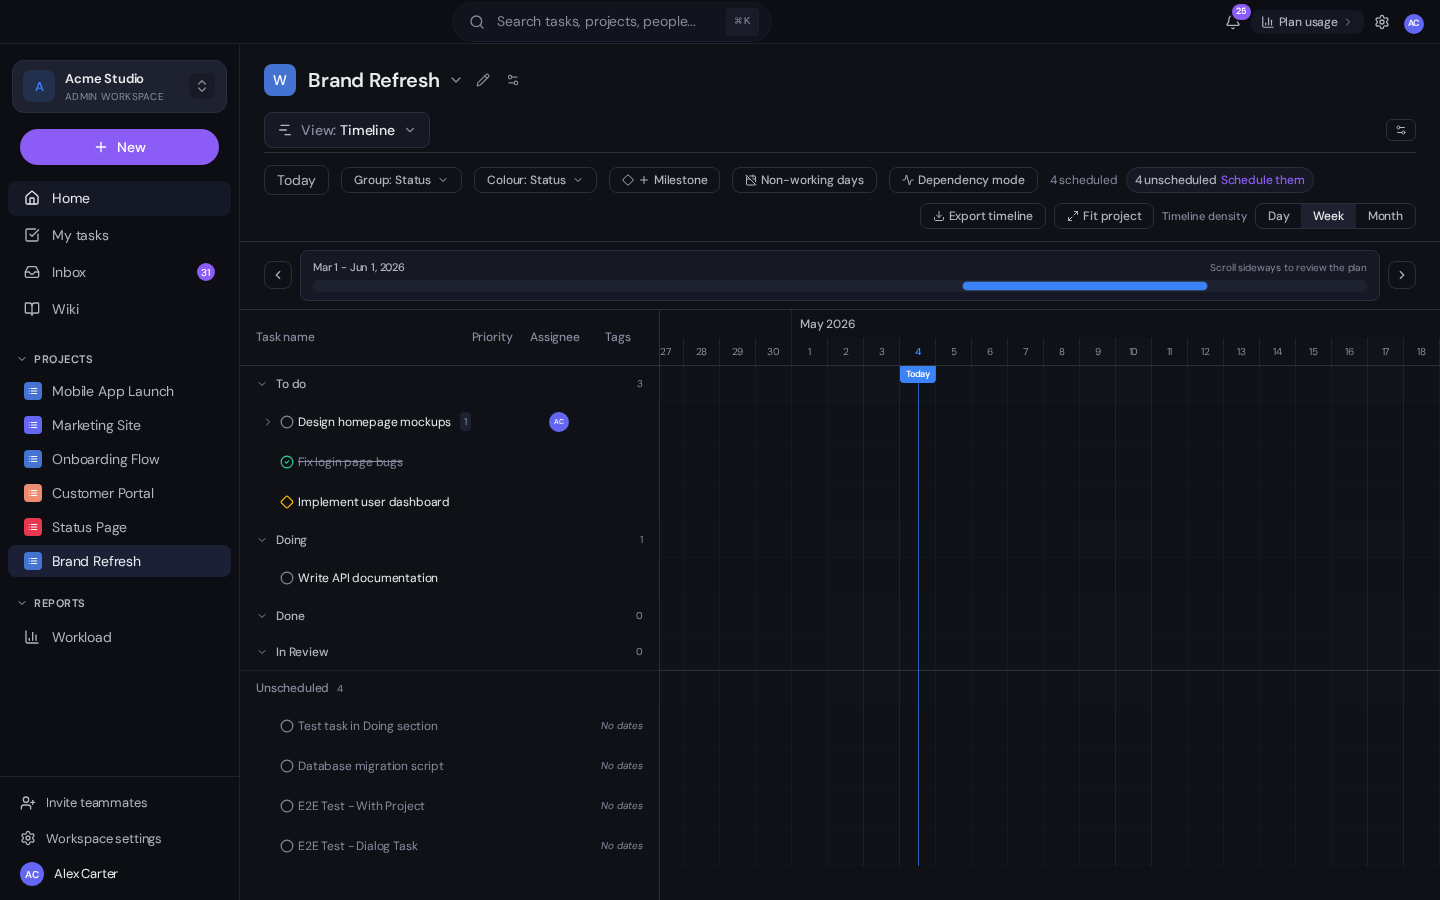
Open any project, click the View dropdown above the task list, and choose Timeline. Gravitask remembers the view per project, so the next time you open this project the Timeline view loads by default. The header gives you four useful controls before you have done anything else:
- Day, Week, Month density. Day view shows every calendar day; Week shows seven-day blocks; Month is the big-picture view across an entire quarter. Use Day for sprint planning, Week for normal project tracking, Month for portfolio-level reporting.
- Group by. Group rows by Status, Section, Assignee, Priority or Tag. Status grouping is the default and shows the workflow at a glance.
- Colour by. Colour the bars by Status, Priority, Assignee or Tag. Status colouring is what most teams keep on; Priority colouring is useful when you want to see where the high-priority work clusters in time.
- Today line. The bright vertical line on the chart shows where you are now. Click the Today button at any time to scroll the timeline back to it.
Step 2. Give each task a start date and a due date
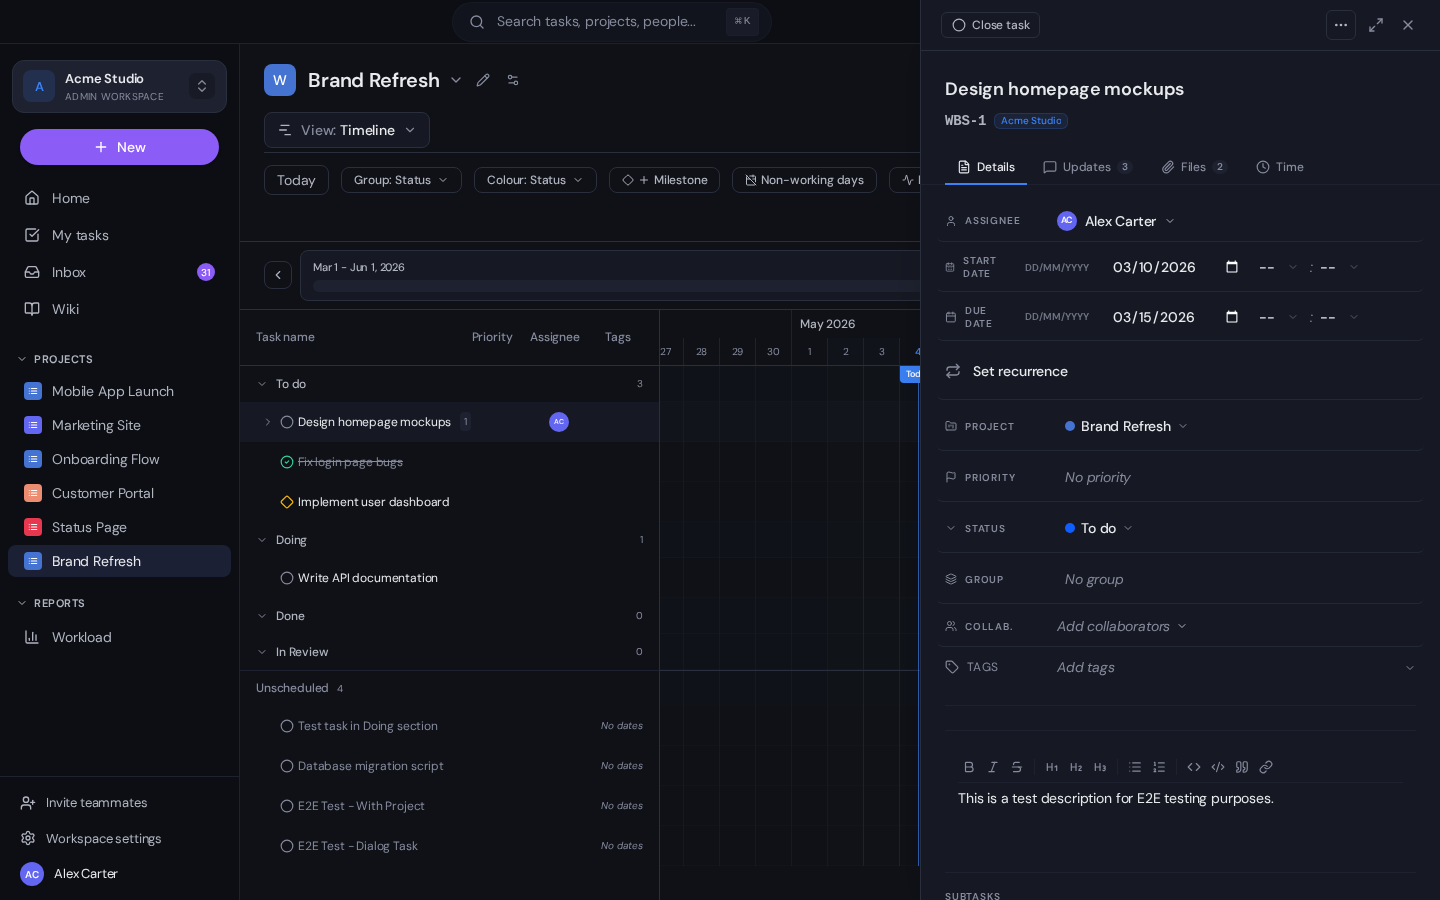
A task with no dates does not appear on the chart yet. It sits in an Unscheduled section at the bottom of the timeline waiting to be planned. To schedule a task, click it to open the task drawer, then set both Start date and Due date. The bar appears on the chart immediately. You can also drag the right edge of an existing bar to extend or shorten it, or drag the whole bar to move both dates by the same amount.
Bulk-schedule unscheduled tasks
If you have a long list of unscheduled tasks, click the Schedule them prompt above the timeline. Gravitask offers an auto-schedule pass that places tasks sequentially using your default working days. You can then nudge individual bars where the auto-pass got it wrong.
Step 3. Link dependencies between tasks
Dependencies are the arrows between bars. They tell the chart that one task cannot start until another finishes (or, in some cases, that two tasks must start together). In Gravitask there are two ways to add a dependency:
- On the chart. Hover over the right edge of a task bar until a small connector dot appears, then drag from that dot to the start of the dependent task. The arrow snaps into place and any downstream dates move automatically if needed.
- In the task drawer. Open the dependent task, scroll to the Predecessors section and add the task it depends on. Use this approach when the predecessor is far away on the timeline and dragging is awkward.
Dependencies are bidirectional in the data model: if you make Task B depend on Task A, Task A automatically lists Task B as a successor. That matters because it powers the next feature, which is the most useful thing a Gantt chart can do for you.
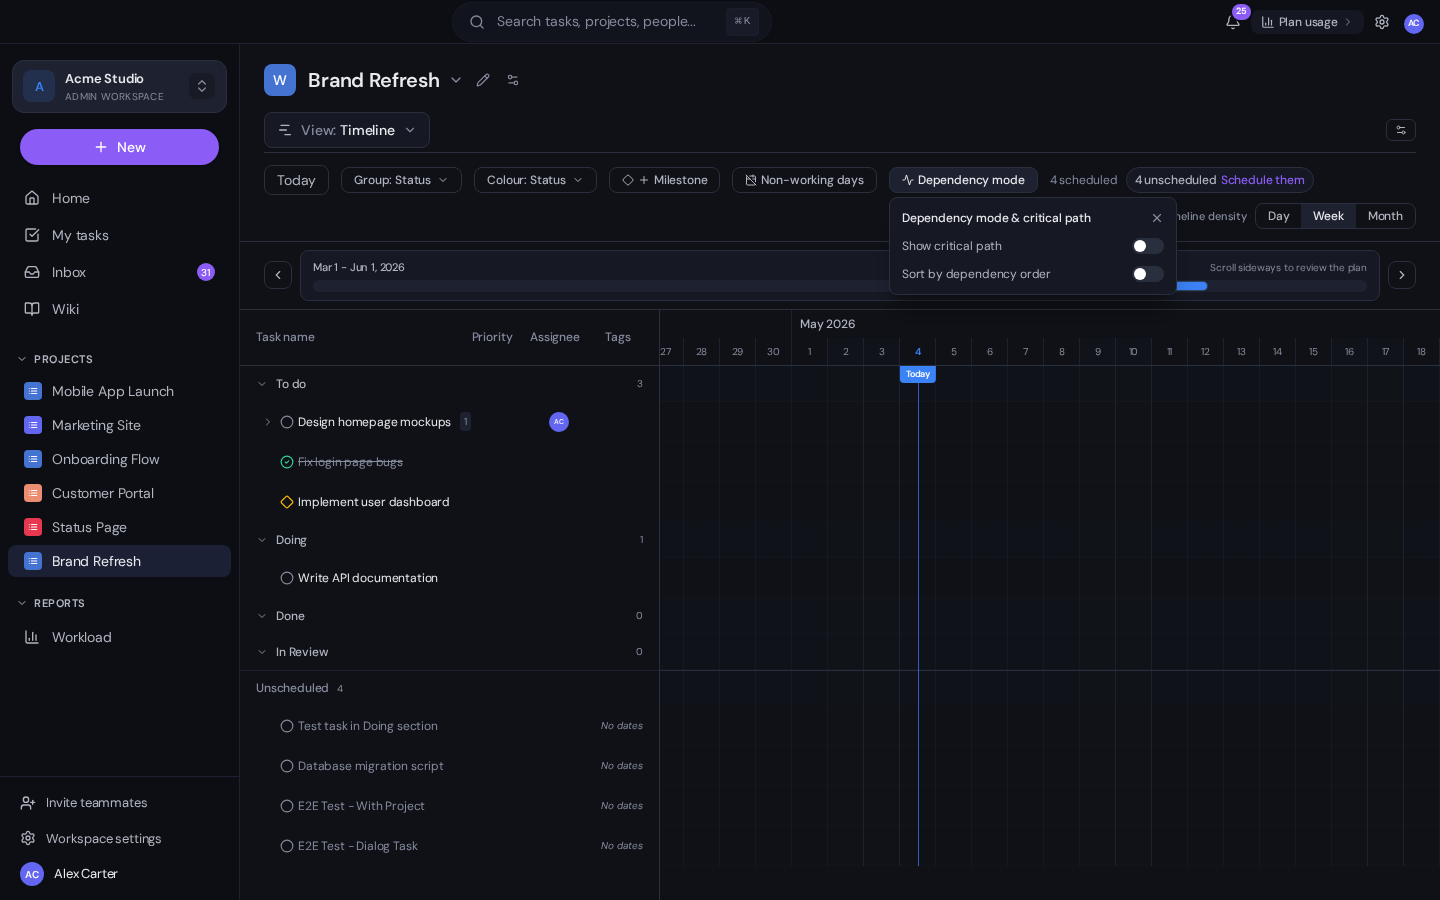
Step 4. Turn on Dependency mode and read the critical path
The critical path is the longest chain of dependent tasks in your project. If any task on the critical path slips by a day, the whole project slips by a day. Tasks not on the critical path have slack: they can move within their dependencies without affecting the launch date. Knowing which tasks are on the critical path is the single highest-leverage piece of project management information you can have.
Click Dependency mode in the timeline header, then enable Show critical path. Gravitask draws the critical-path tasks with a red highlight and bolder dependency arrows. Now look at your chart: those red bars are where you should be focusing attention. A delay on a critical-path task slips the launch. A delay on a non-critical task probably does not.
Sort by dependency order
In the same popover, the Sort by dependency order toggle re-orders the rows so that earlier tasks (no predecessors) sit at the top and later tasks (many predecessors) sit at the bottom. Combined with critical-path highlighting, this turns the chart into a top-to-bottom reading of "what has to happen, in what order".
Step 5. Add milestones
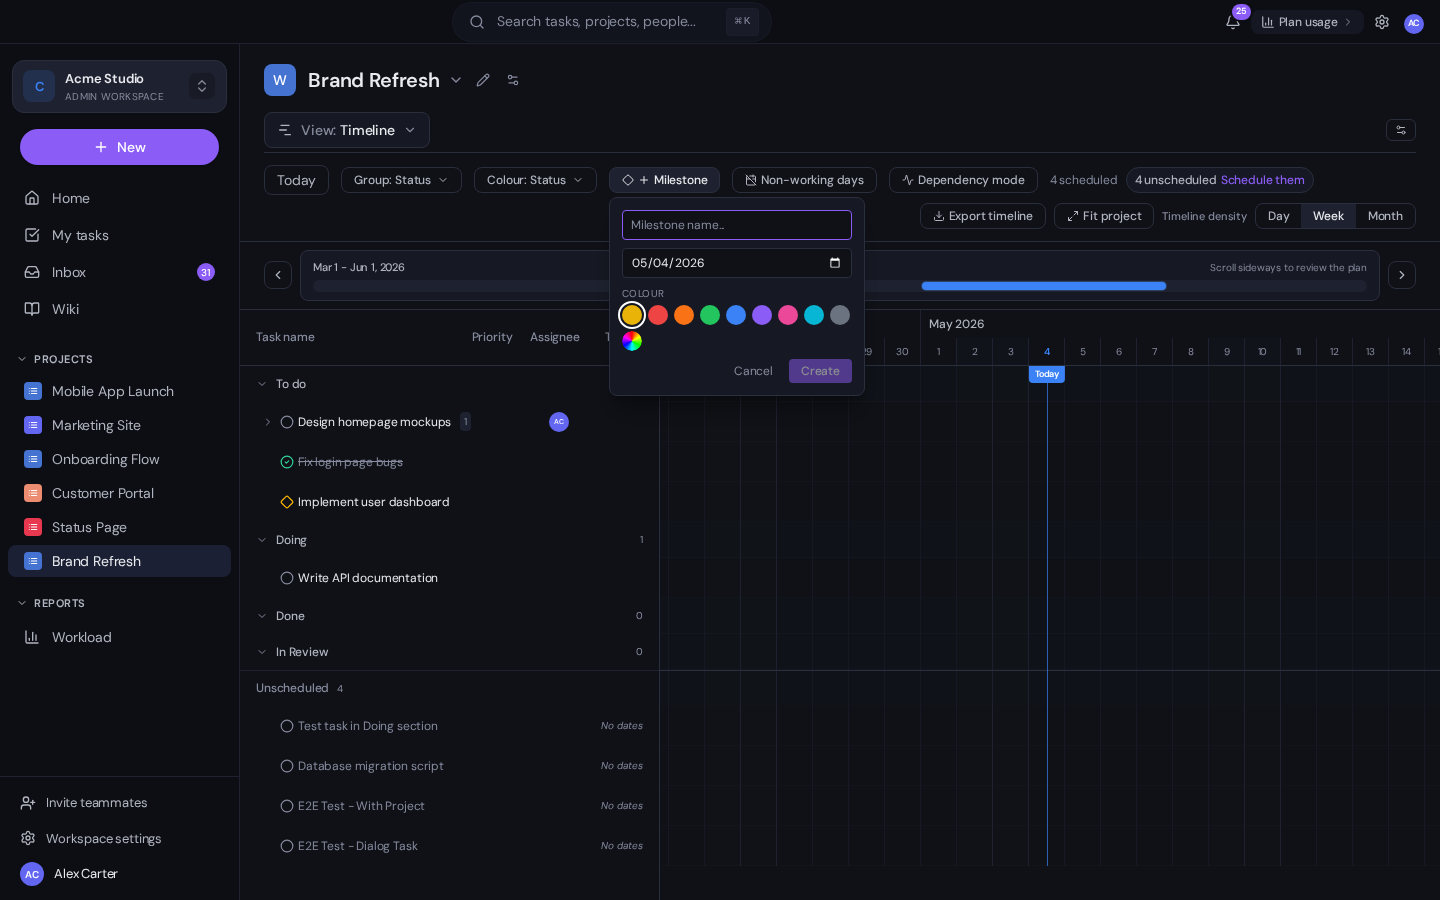
A milestone is a zero-duration marker on the chart. It does not represent work that takes time; it represents a moment that matters: a launch date, a gate review, a contractual deadline, a regulatory submission. On the chart, milestones render as small diamond shapes you cannot miss.
Click the + Milestone button in the timeline header, give the milestone a name (for example Soft launch or Beta gate), pick a date, and choose a colour. The milestone appears on the chart at that date and stays visible regardless of which group or filter you have applied. Critical-path calculation also accounts for milestones: if the milestone has predecessors, the chain of work needed to hit it is part of the critical path.
Step 6. Switch density depending on the audience
A Gantt chart is more readable in some densities than others depending on what you are trying to show. The Day, Week and Month toggles in the header switch the time scale instantly without losing your scroll position:
- Day is the right density for sprint-level planning and for the next two to three weeks. You can see individual days, including weekends, and exact bar starts and ends.
- Week is the default project view. Each column is a calendar week. Most teams live in this density.
- Month is for portfolio reviews and quarterly planning. The bars get short and the dependency arrows get easier to read because there is more space between rows.
Click Fit project at any time to auto-zoom the timeline so the project start and end fit on screen. This is the right thing to do before exporting a screenshot for a stakeholder update.
Step 7. Use non-working days, groups and colour
Three smaller controls round out the chart:
- Non-working days shades weekends and any holidays you have configured. With this on, dependency rescheduling skips weekends automatically, so a five-day task starting Wednesday actually finishes the following Tuesday rather than Sunday.
- Group: Status / Section / Assignee / Priority / Tag breaks the rows into bands. Grouping by Assignee turns the chart into a workload view; grouping by Section keeps the chart aligned with how the team thinks about phases.
- Colour: Status / Priority / Assignee / Tag changes the colour of the bars. Priority colouring is the quickest way to spot whether your highest-priority work is also the work currently in progress.
Step 8. Share the timeline with stakeholders
You have three ways to get the chart in front of someone who does not have a Gravitask account:
- Export timeline. The Export button in the header generates a high-resolution PNG of the current view (with whatever filters, density and grouping you have on). Drop it into a Notion update, a slide deck or an email.
- Share via guest access. Invite stakeholders as guests on the project. They get a read-only view of the same Timeline, always live, no exports required.
- Embed in a wiki page. Gravitask wiki pages can embed any project view, so you can keep a permanent live link to "the launch plan" inside a stakeholder-facing page.
Common Gantt chart mistakes (and how Gravitask helps you avoid them)
Treating the Gantt chart as a status report
A Gantt chart is a plan, not a report. If the chart shows the same plan it did three weeks ago, it is wrong. Update due dates as work happens. Gravitask makes this easier by letting you drag bars directly on the chart, and by recomputing the critical path automatically when anything changes.
Adding fake dependencies just to keep tasks aligned
Dependencies should mean "this cannot start until that finishes". Adding a dependency just to make the chart look tidy pollutes the critical-path calculation and gives you a false sense of risk. Use Group by Section if you want visual alignment without semantic dependencies.
Planning every task in detail six months out
Gantt charts are most accurate one to two months out and progressively fuzzier after that. Plan the next phase in detail; sketch later phases with milestones and a few representative tasks. Refine as you go.
Ignoring the critical path
If you only do one thing with your Gantt chart, do this: turn on Dependency mode, look at the red tasks, and ask "is anything on this list at risk?" That conversation, weekly, is the difference between hitting and missing a launch.
FAQ
Is the Gravitask Gantt chart available on the free plan?+
Yes. Gantt (Timeline) view is included on every Gravitask plan, including the free tier. Critical-path calculation, dependency arrows, milestones and density toggles all work on free.
How do I show predecessor tasks?+
Two ways. On the chart, hover the right edge of a task bar and drag the connector dot to the next task. In the task drawer, scroll to the Predecessors section and add the upstream task by name. Both methods produce the same dependency, and either side of the relationship can edit it.
What is the critical path and how does Gravitask calculate it?+
The critical path is the longest chain of dependent tasks in the project. Any delay on a critical-path task slips the project end date by the same amount. Gravitask uses the standard Critical Path Method: it walks the dependency graph forward to compute earliest start and finish dates, walks it backward to compute latest start and finish dates, and flags tasks where those dates are equal (zero slack) as critical.
Can I drag a task bar to reschedule it?+
Yes. Drag the middle of a bar to move both start and due dates by the same amount; drag the right edge to extend or shorten the duration. If the task has dependents, Gravitask asks whether you want downstream dates to move with it.
How do milestones differ from tasks?+
Milestones have zero duration and represent a moment rather than a piece of work. They show as diamond markers on the chart, can have predecessors (the chain of tasks needed to hit the milestone), and are included in critical-path calculations.
Can I export the Gantt chart as a PDF or image?+
Yes. The Export timeline button in the header generates a high-resolution PNG of the current view, including whatever density, grouping and filters you have applied. PDF export is available on Business plans and above.
Does the Gravitask Gantt chart work on mobile?+
The mobile app shows a read-friendly version of the timeline with horizontal scroll. Editing dates and dependencies is easier on desktop, but the read view (including critical path and milestones) works fine on a phone for status checks.
Can I link tasks across different projects?+
Yes. Cross-project dependencies are supported: open the predecessor picker in the task drawer and switch to a different project. Cross-project dependencies show on both projects' Gantt charts and are included in each project's critical path calculation.
Where to next
For the conceptual side of project planning, see MCP for project management which covers how AI assistants can help you keep the Gantt chart honest. For the playbook on what to automate around the chart (auto-schedule, deadline-warning rules, status digests) see AI task automation: a practical playbook. And if you want Claude or another AI client to help you reason over the critical path directly, How to connect Claude Code to Gravitask walks through the setup.
Timeline planning next steps
Build your next project timeline in Gravitask.
Start free, add due dates and dependencies, then move from plan to delivery without rebuilding the same tasks in another tool.